Gaining enough visibility on what’s going on in your services can be a struggle. Here I will show how distributed tracing can help with that and what some of the benefits are that we encountered while implementing it.
What is Distributed Tracing
In its most basic form, distributed tracing is a system designed to enable you to follow a request through multiple servers. Once a request by a client hits one of your servers, a trace-id is generated which uniquely identifies the request. If this request is passed on to another service, that same trace-id is passed on as well. This way everything that was caused by the request can be traced back to it.
Additionally for everything that happens inside a single service a span is generated. This could be for example a database request, an expensive calculation, or anything else you want to define yourself. These spans are hierarchical so that the final data being collected about a request will look like this:
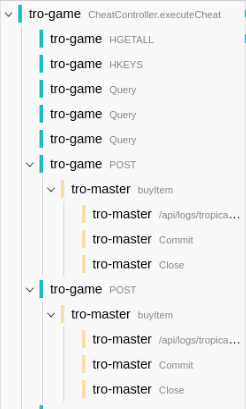
Here tro-game and tro-master are services running on different machines. Each row is a span. All of the data together is part of a single trace representing an HTTP request by the client.
OpenTracing
OpenTracing is a set of APIs and specifications that allow you to implement distributed tracing in a vendor-neutral fashion. There are several implementations available for different languages, including Java, PHP, and C#.
Jaeger
This is the tracer that we decided to use, as it fit our requirements best (open-source, free, language support). Jaeger is an open-source distributed tracer, that supports OpenTracing. It collects all traces in a central location and makes them accessible via a web interface. You can search for traces using different filters.
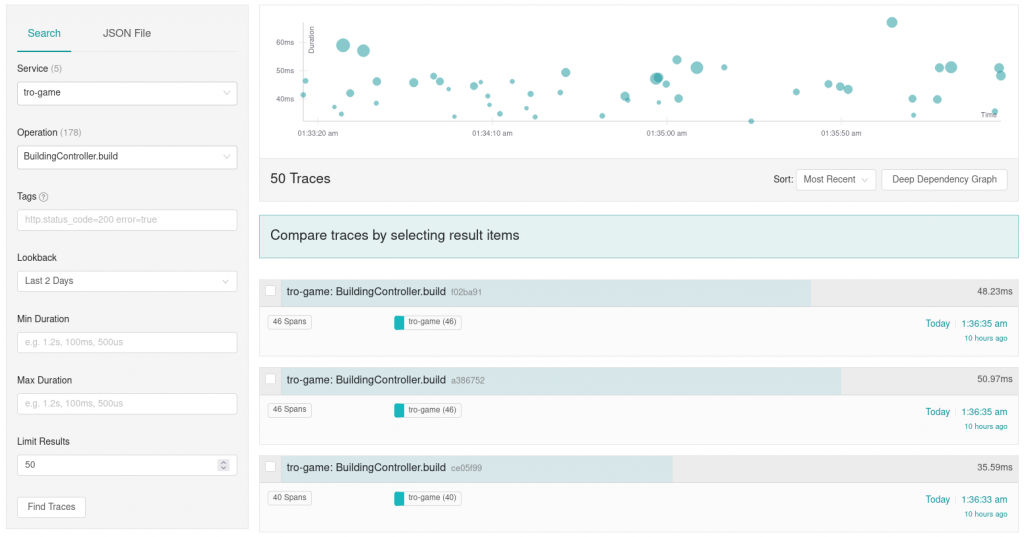
You can open the details of specific traces.
And more. Some examples are listed in the use cases below.
Setup
As we are using Spring Boot for our services, integration was very straightforward. We included some libraries in our build and set up the appropriate configs.
api group: 'io.opentracing.contrib', name: 'opentracing-spring-jaeger-web-starter'
api group: 'io.opentracing.contrib', name: 'opentracing-spring-jaeger-cloud-starter'
api group: 'io.jaegertracing', name: 'jaeger-core'
Out of the box, this already created new traces for incoming HTTP requests, which were also forwarded to other services. It also added spans for database requests.
Then we added some custom code around actions that were not already traced or just required more details and we were good to go.
Span span = tracer.buildSpan("span-name").start();
try (Scope scope = tracer.activateSpan(span)) {
  doStuff();
  span.finish();
}
Limitations
Storing a large number of traces can require a considerable amount of resources (disk space e.g.). We use a limited sample rate to limit the impact of this.
We were not able to measure any significant performance impact after implementing Jaeger into our services. Jaeger itself performs very well when handling a large number of events, too.
Use Cases
Here are some real-life use cases that we ran into.
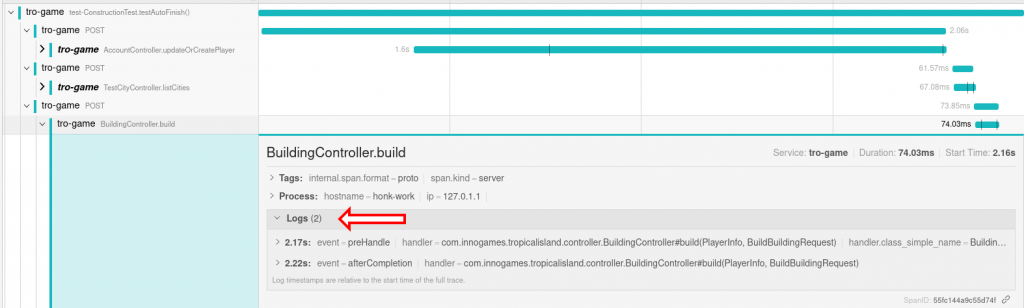
Multiple Servers
The most obvious use case is the one already described: following a request over multiple services (could be micro services for example, on the same or different physical machines). This gives great visibility into which services are involved and in which order. With the appropriate spans being created, this will also tell you what they are doing.
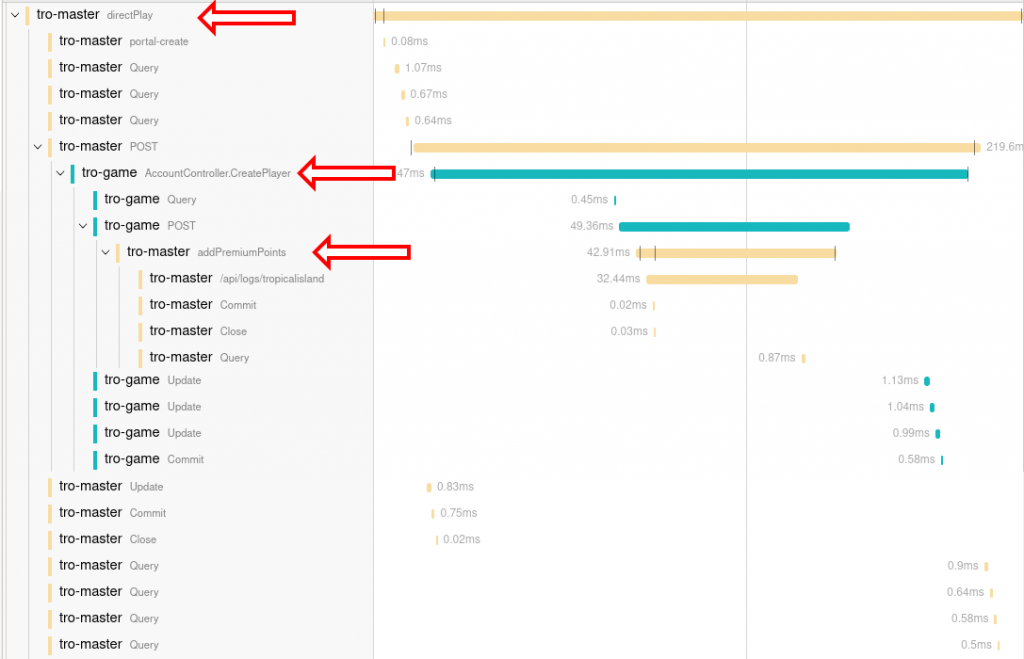
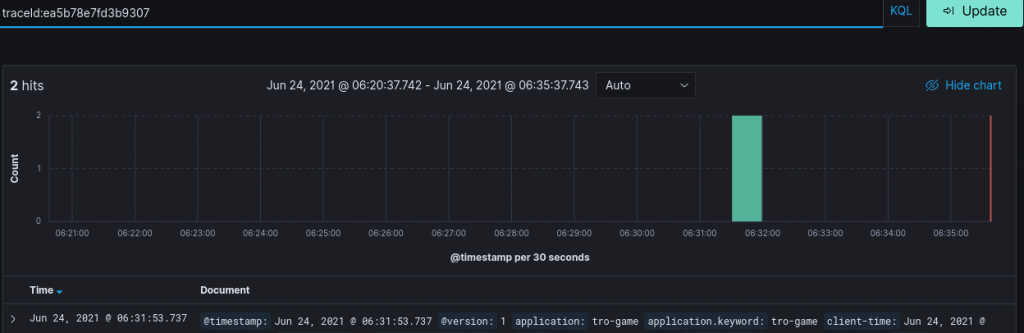
Here is one such example. A new player is registering to play our game. He does this on one service (tro-master, top arrow) first. This service then calls the game world he will play on (tro-game, 2nd arrow). So far so good. The game world however gives the player some free premium points to get started, which again calls tro-master (3rd arrow). Having this visible representation makes it rather obvious, that this flow could easily be improved.
Without tracing, it is definitely more difficult to see which calls are happening in which order during a request.
Finding Logs
We also use the trace-id to find logs in case something goes wrong. As a trace-id identifies a request, it is quite easy to use it to find logs related to this request. Here I caused an error in the game to occur.
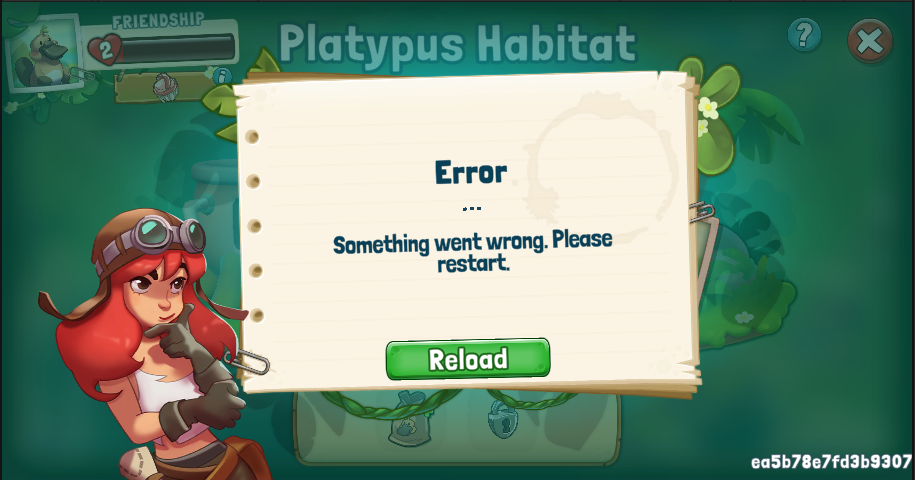
The text you can see in the bottom right of the screen is the trace-id for the request that failed. We send it to the client in case something goes wrong. One quick copy&paste later, the logs are there.
No need to know which server this happened on, no need to search by player or limit it by time. Two log entries were found for this trace-id in our log monitor, and we could begin immediately to figure out what’s wrong.
Performance
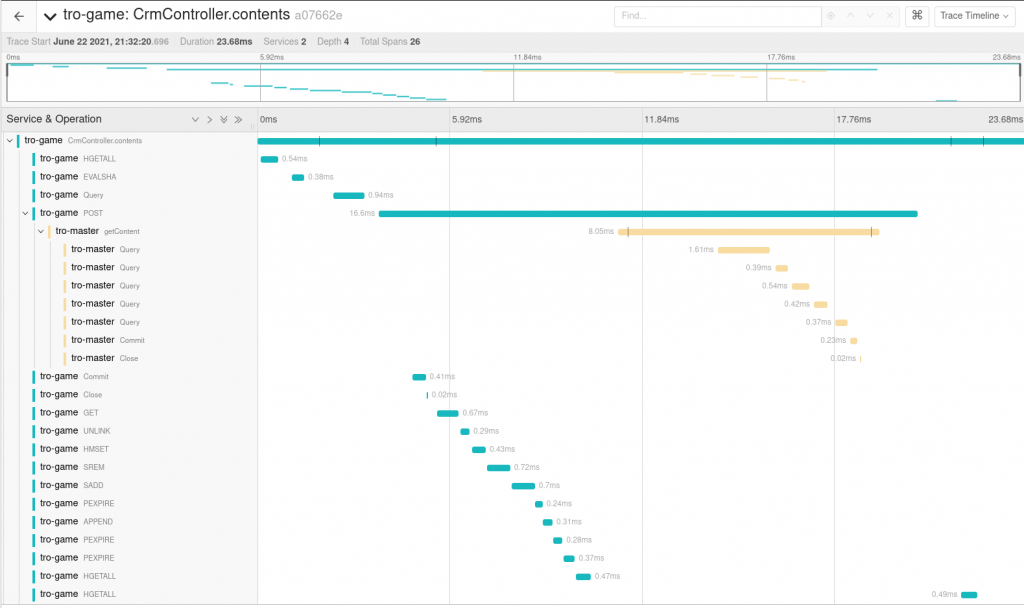
One big topic that distributed tracing helps with is gaining performance insights. You may have already seen it in the screenshots above, but Jaeger does not only show what happened (which spans) but also how long everything took. It is quite easy to spot that a request to a different service – even if it is fast – takes a lot longer for us than a request to the database e.g.
In Jaeger, you can also search by the duration of the trace. If you want to know why some of the requests are slow, simply search for them and take a look. Often it will be easy to spot quickly where the time is being spent.
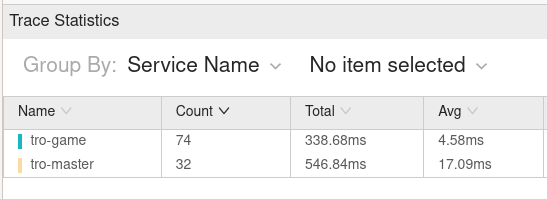
Another interesting feature is the “Trace Statistics” view. Here you can get statistics about the spans in a specific trace. If you want to know which service took how long to process the request, you’re covered:
You can group by different properties. Here I find db.statement especially useful. It will not only tell you whether a request to the database took particularly long, but also whether you’re doing the same request multiple times.
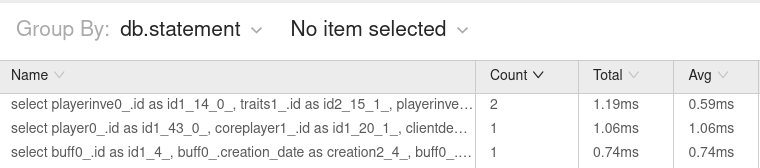
Optimizing how many database queries we’re causing and how long they are taking is rather important when it comes to scaling to a larger player count. So this has helped find several easy-to-avoid queries.
Caveat
This should not be the only tool you use for ensuring your services are performant. While checking out a few slower traces here and there is useful, it will not give you the full picture of what’s going on.
Hard to Reproduce Bugs
This one we did not expect when we started implementing tracing into our game, but it was a welcome benefit. Besides showing the spans, it is also possible to see log messages that were caused inside a span. Logs created using a logging framework are automatically added to the span, but it is also possible to add logs directly to the span only.
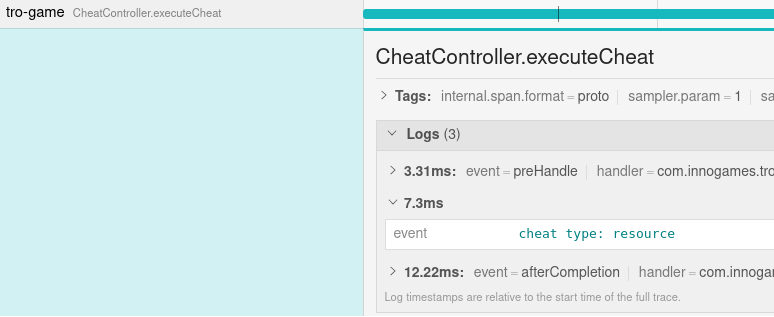
We were able to use this when debugging some hard to reproduce bugs in our JUnit tests. Imagine the following scenario:
- A test is flaky, maybe every 1000th execution fails.
- The test only fails if other tests are running in parallel. (Yes, we do run our tests in parallel to speed up execution time.)
How do you go about debugging this? Breakpoints won’t be helpful because you don’t know where it fails, and if you step through it won’t fail, because nothing else is running in parallel. The usual approach is – after divining what’s wrong by staring at the code has failed – to add debug logs everywhere to at least narrow down where the problem occurs. But when running thousands of executions concurrently, even understanding these logs can be difficult.
And here is where Jaeger shines. In our setup, every executed test corresponds to a trace. The trace-id is printed in case there is an error. So all we have to do to debug the error is to add the logs, run the test, wait for the failure and check in Jaeger with the trace-id. We achieved this by creating a JUnit extension which opens a new span before each test execution and closes it afterwards.
And there we have it, a JUnit test with multiple HTTP requests and exactly the logs that were are interested in.
Conclusion
Distributed tracing is great. Not having a vendor lock-in due to using OpenTracing is good to have. We were able to find issues and performance improvements that would have been harder to spot using other methods. Integration into our project was pretty low effort but paid off quickly.
But tracing is not going to cover all your monitoring needs. It is only one tool in your toolbox.
InnoGames is hiring! Check out open positions and join our awesome international team in Hamburg at the certified Great Place to Work®.